Making sense of public data
No opinions, just straight facts. We sift through reams of public data from Statistics Canada, the World Bank, the United Nations, OECD, and more to explain the trends that matter.
40+
datasets
50+
articles
20+
sources
READ INSIGHTS
What the data reveals
CANADA

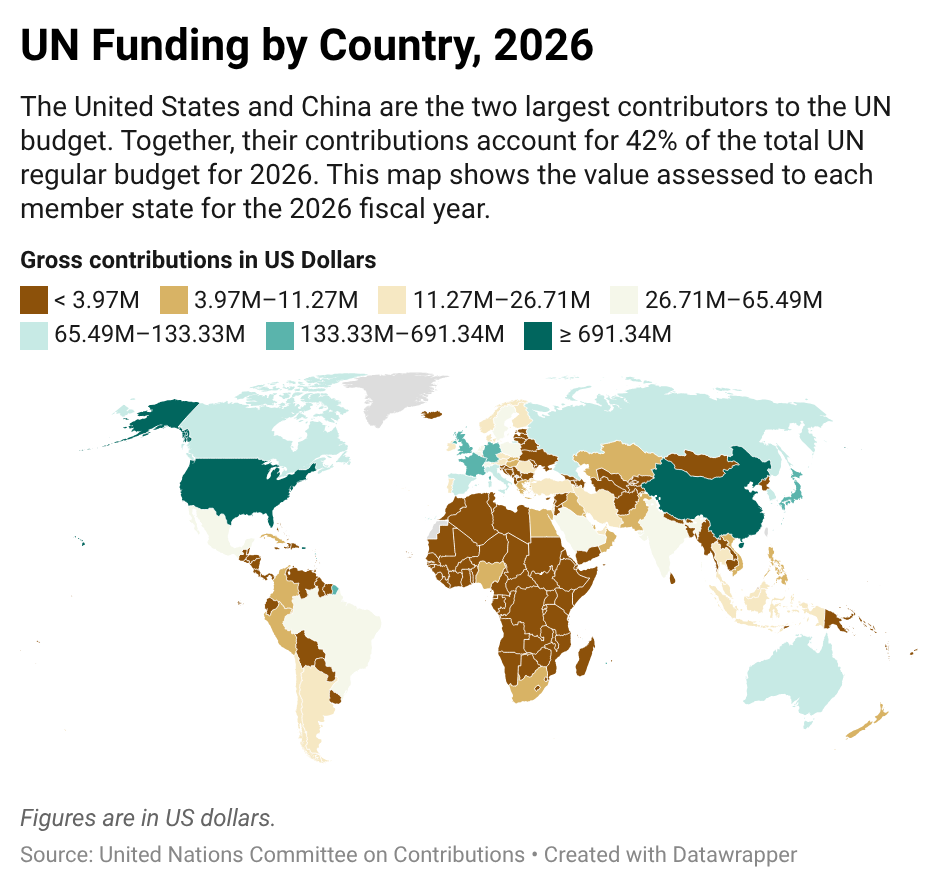
How is the United Nations funded?
On December 31, 2025, the UN General Assembly approved a regular budget of $3.45 billion for 2026. All members of the UN are required to contribute, but the amount varies. Learn who contributes the most and what happens when members fail to meet their financial obligations.
INTERNATIONAL
Explore data from around the world
GET THE DATA
Putting data about Canada into context
CANADA FACTS
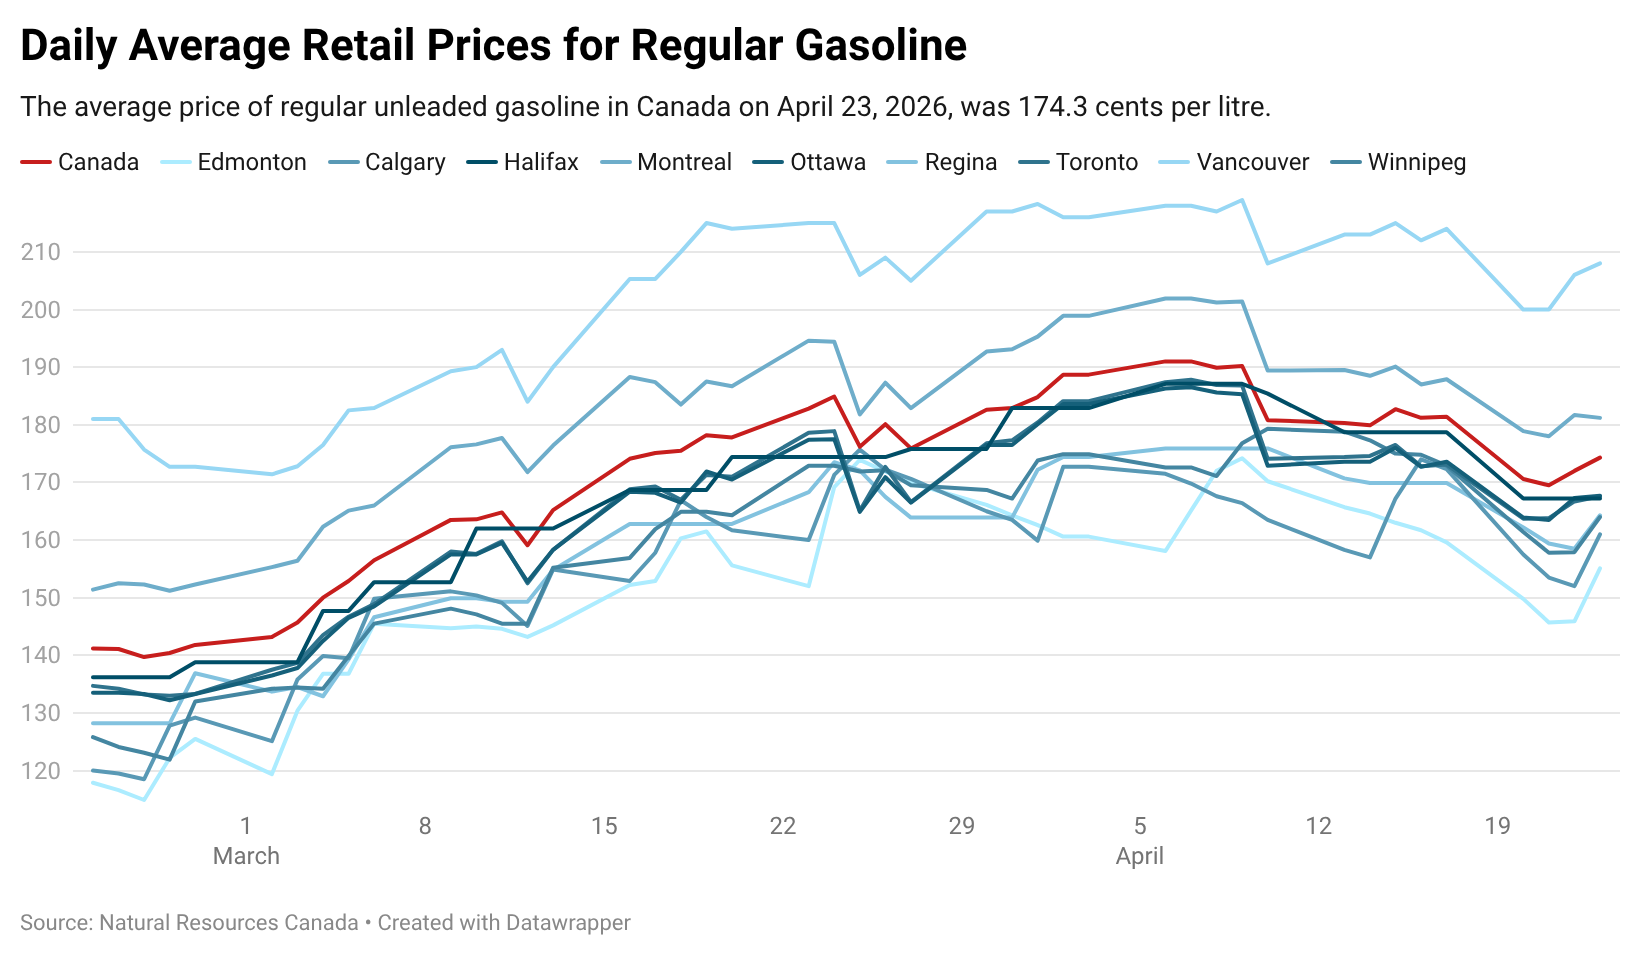
ECONOMY

Ontario has an extensive public transit system, serviced by 106 municipal transit authorities and two provincial transit authorities, funded by revenues from fares and subsidies from municipal, provincial, and federal governments.
How is Ontario’s public transit system funded?

How many Canadians have Registered Retirement Savings Plans?
Many Canadians rely on additional sources of income, such as Registered Retirement Savings Plans or RRSPs, to fund their retirement. Learn how many Canadians have RRSPs.
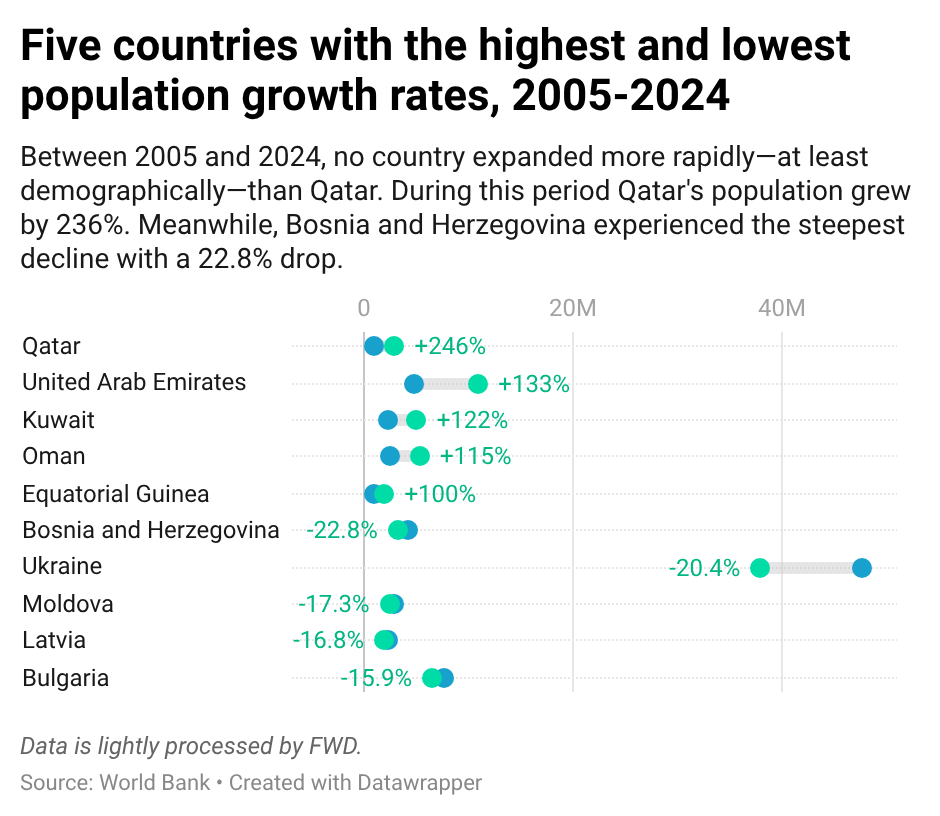
POPULATION
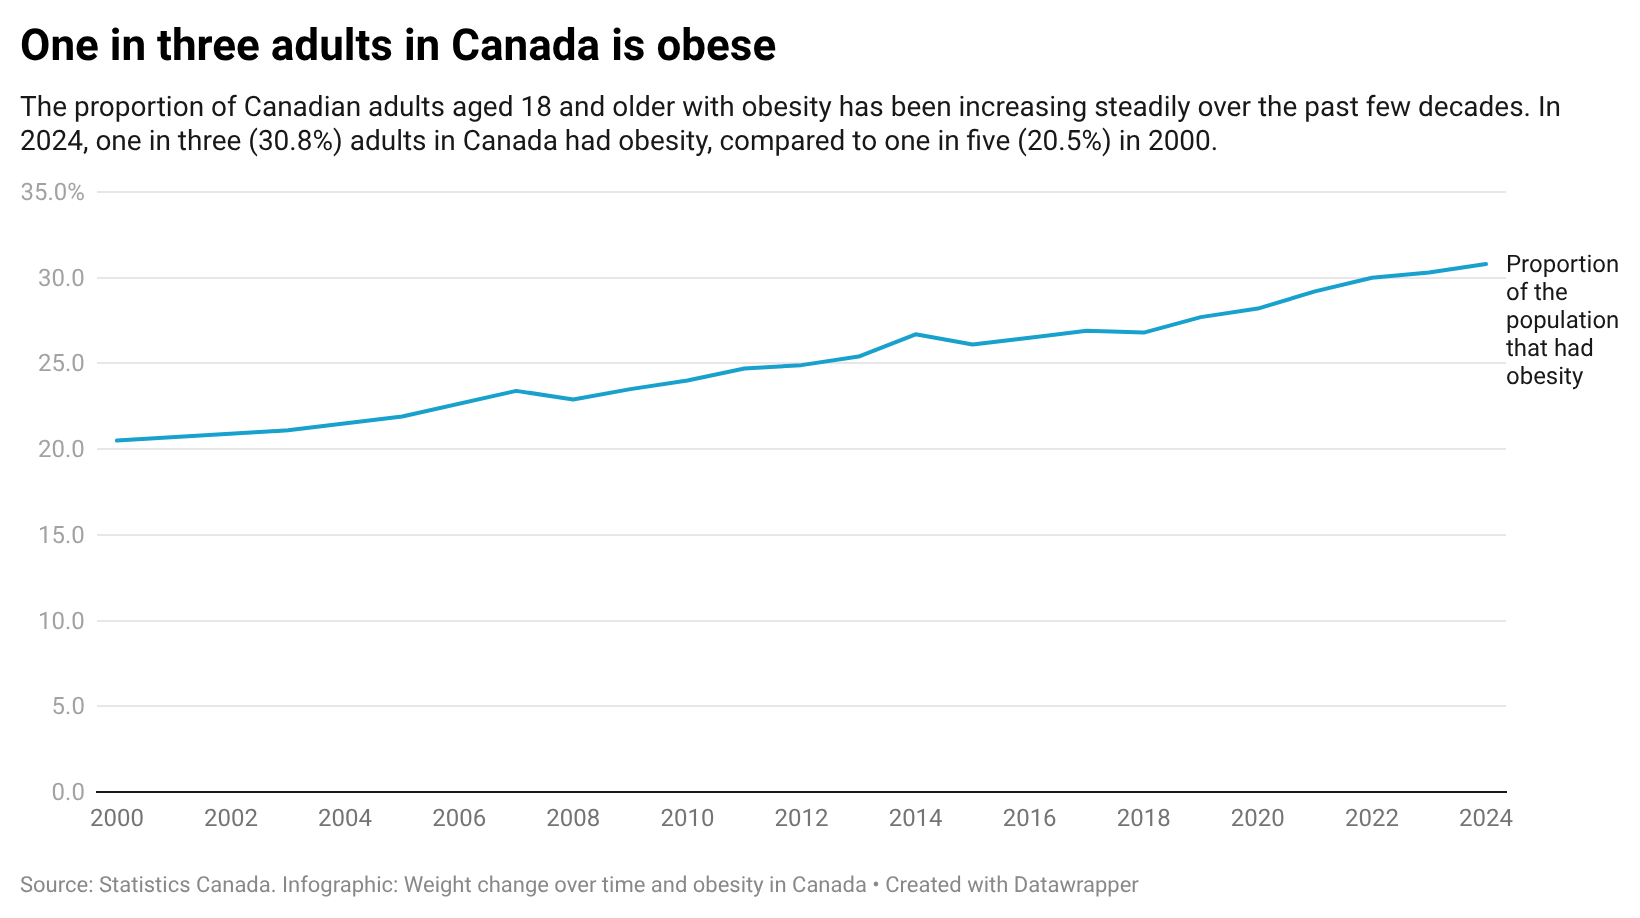
HEALTH


ENVIRONMENT


CHART OF THE WEEK
Bite-sized insights, published every Friday
The average cost of milk in Canada inches upward
The average price of 2 litres of milk across Canada in February 2026, was $5.47, up $0.06 from the month before, and $0.13 more expensive than the same period from a year ago. Explore how the price of milk has changed across provinces.
TRENDLINES
Exploring topics shaping the world