What percentage of the world uses the internet?
The internet has changed the way the world works, learns, and forms connections. In 2023, about 7 in 10 people globally had access to the internet via a computer, mobile phone, games machine, streaming services, etc. Learn about how access and usage trends have changed between 2015 and 2023.
Canada Facts
Putting facts about Canada into context.
Registered Retirement Saving Plans or RRSPs are an important part of the retirements savings equation for many Canadians. These plans provide additional funds upon retirement, giving people an added level of financial security. Learn how many Canadians invest in RRSPs.
In 2023, Statistics Canada reported that 5.3 million Canadians—about 3 in 10 employees—were covered by collective bargaining agreements. Of which 76.7% of public sector employees were unionized compared to 15.5% of employees in the private sector.
In 2023, the agriculture sector in Canada employed 280,798 people, of which 79,734 or 28% were temporary foreign workers. This represents an increase of 15,085 people from the year before.
Chart of the Week
Bite-sized insights on how Canada is changing, published every Friday.
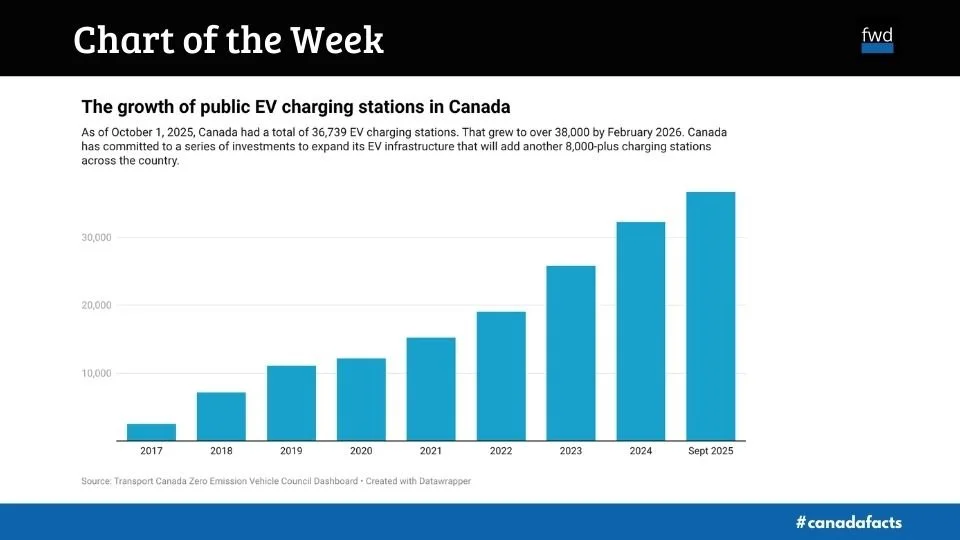
Canada’s EV charging station network is growing
Canada has committed to expanding its electric vehicle charging network. Since 2016, it has spent $1.2 billion to build out a network of more than 14,000 charging stations with 38,000-plus charging ports. It plans to scale this up over the next few years by adding more than 8,000 new charging locations. See how the network has grown since 2016.
Trendlines
Exploring issues and topics shaping the world and their impacts on Canada.
As of November 2025, U.S. government debt reached $36.2 trillion, with foreign investors holding $9.35 trillion—about 26%—through U.S. Treasury securities. Learn which country holds the most US debt.
The internet has changed the way the world works, learns, and forms connections. In 2023, about 7 in 10 people globally had access to the internet via a computer, mobile phone, games machine, streaming services, etc. Learn about how access and usage trends have changed between 2015 and 2023.
Stock exchanges link companies and investors globally, fueling growth and innovation. Find out which country has the most publicly listed firms.
Explore global oil production in 2024—from the U.S., Russia, Saudi Arabia to Canada and Iran—powered by data from the 2025 Statistical Review of World Energy.
On December 31, 2025, the UN General Assembly approved a regular budget of $3.45 billion for 2026. All members of the UN are required to contribute, but the amount varies. Learn who contributes the most and what happens when members fail to meet their financial obligations.
See how global population surged from 3 billion in 1960 to over 8.14 billion by 2024 and how Canada’s demographic future hinges on immigration from fast-growing regions.
See which countries lead the world in life expectancy in 2023, with insights on global averages, regional trends, and differences between men and women.
Tokyo tops the global rankings of the world’s largest cities with an urban agglomeration of about 37 million people (2025). Discover the world’s most populous megacities by metro size.
Getting started with Python
Up your data analytics game by mastering the basics of Python.
Extracting structured data from PDFs can be frustrating. PDFs are designed for presentation, not data analysis. But with a few Python libraries and a bit of code, getting data from tables within a PDF can be a fairly smooth process. Learn how.
Learn how to get started with pandas, Python’s powerful data analysis library. This beginner-friendly guide covers installation, importing pandas, creating DataFrames, and performing basic operations to help you master data analysis in Python quickly.
Learn how and why data analysts use the pandas melt() function to reshape wide data into long, tidy tables. Includes syntax breakdown, examples, and practical tips for easier data analysis and visualization.
Learn to sort and rank data, which will allow you to uncover patterns, identify leaders and laggards, and compare values quickly.
The Data Analytics Toolbox
Find overviews and how-to articles on topics geared towards helping you become a better data analyst.
Learn how to download, clean, and transform World Bank data for analysis. This step-by-step guide explains dataset structure, wide vs. long formats, and how to prepare World Bank indicators for use in Excel, Google Sheets, or data visualization tools.
Learn how to find key financial metrics for Canadian-listed companies using SEDAR+ filings and IFRS reports. This guide covers where to locate revenue, expenses, EPS, cash flow, and executive compensation in Canadian disclosure documents like annual reports, MD&A, and AIFs.
Learn where to find revenue, expenses, net income, EPS, executive pay, EBITDA, cash flow, and other key financial metrics in corporate filings like SEC 10-Ks and DEF 14A.
Learn how to make better data visualizations inspired by Storytelling with Data. Discover 10 chart design tips that help you simplify visuals, use color effectively, and communicate insights clearly.
MS Excel Basics
Charted
Finland is the happiest country in the world, according to the latest World Happiness Report. It’s the eighth consecutive year the Nordic country has topped the list. Following Finland are fellow Nordic countries Denmark, Iceland, and Sweden. The Netherlands rounds out the top five.
In 2023, mines in China produced an estimated 378.2t of gold, about 11% of the gold produced globally, making it the top gold-producing nation in the world, a position it has maintained for the past 15 years. Russia, Australia, Canada and the United States are among the top five.
As the world races to decarbonize and bring on cleaner sources of electricity, it got us wondering how North America’s electricity grid stacks up against the rest of the world. In this story, we explore North America’s electricity mix in 2023 and how it has changed over the years.
In 1995, Fortune Magazine released its first-ever Global 500 - a list of the top 500 companies in the world based on revenue. In this story, we explore the 500 largest companies in the world by revenue.
The global economy is powered by maritime trade. It’s estimated that 80% of the world’s goods – food, raw materials, manufactured products, etc. – are transported by sea. In this article, we explore the world’s busiest container ports in 2022.


Since 2016, Canada has been ramping up construction of key infrastructure to support Canadians switching from gas-powered vehicles to zero-emission vehicles, including electric charging stations. Dive into the data to explore how many electric charging stations there are across the country and which provinces have the most robust system.